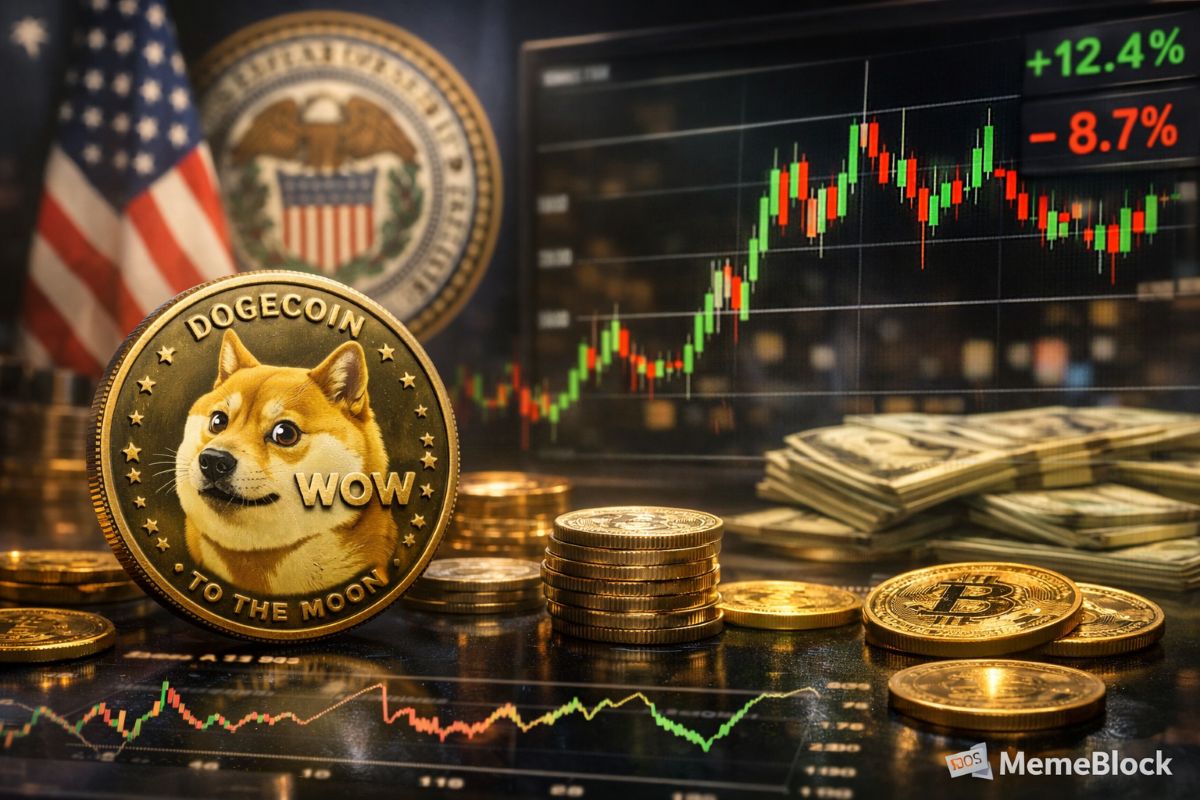
The Bitcoin Greed & Fear Index, a gauge of trader and investor sentiment in the Bitcoin market, has plunged to its lowest reading in over a year, signalling “extreme fear” among market participants. Many analysts believe such conditions may indicate a tactical bottom is approaching for Bitcoin.
What the index is showing
- The index has dropped below the 20-point mark (on a scale of 0-100) for the first time since early 2024, when Bitcoin previously entered a major correction.
- Historically, readings under ~25 often mark short-term market bottoms, though they are not guarantees of a sustained rally.
- The sharp drop comes amid large liquidation events, wallet inflows to exchanges, and general risk-off sentiment across asset markets.
Why it may signal a tactical bottom
- Contrarian indicator: When fear is at extremes, many informed investors use it as a cue to begin accumulation, hoping the worst is priced in.
- Overshoot potential: Markets often overshoot on the downside during fear phases, meaning the worst may already be behind us.
- Relative value: With valuations depressed and speculative froth removed, risk-reward may increasingly favour entering long-term positions rather than staying on the sidelines.
Key caveats
- Not a timing tool: The index signals sentiment, not fundamental bottoms; it does not guarantee price reversals or that risk is eliminated.
- Structural risks remain: Crypto markets still face macro headwinds (interest rates, regulation), on-chain usage challenges and derivative excess that may continue to drive volatility.
- Liquidity risk is elevated: While sentiment is extreme, buyers may still be scarce, and if a new negative catalyst hits, indexes can go even lower.
What to watch next
- Bounce attempt: Look for Bitcoin to reject major support levels and rally with volume as a possible early bottom signal.
- Derivative stress easing: Reduction in liquidation volumes, return to positive funding rates for longs, and declining exchange deposit flows may indicate reduced selling pressure.
- Sentiment shift: If the Greed & Fear Index begins to rise (from “extreme fear” toward “fear” and “neutral”), it may indicate repositioning is underway.
- Fundamental upgrades: News of meaningful ecosystem developments, regulatory clarity, or institutional adoption may spark a sentiment change.
- Macro relief: An unexpected dovish move by central banks, or other monetary easing, could improve risk-asset appetite and benefit crypto.
FAQs
Q1: What is the Bitcoin Greed & Fear Index?
A1: It’s a sentiment gauge that aggregates factors like volatility, market momentum, social media sentiment, dominance and trends to estimate whether traders are overly greedy (risk-on) or fearful (risk-off). Scores range from 0 to 100, with lower scores indicating greater fear.
Q2: What does a low reading mean? Is it a buy signal?
A2: A very low reading (e.g., below ~25) historically suggests fear is at extreme levels, which can correlate with short-term market bottoms. It’s more of a contrarian indicator than a definitive buy signal; context and fundamentals still matter.
Q3: Are we definitely at the bottom for Bitcoin?
A3: Not necessarily. While sentiment is extremely pessimistic, there remain significant risks (macro, regulatory, protocol) that could push prices lower or delay a sustainable reversal. The index alone cannot guarantee a bottom.
Q4: Should I invest now because the sentiment is so negative?
A4: It depends on your risk profile and time horizon. Some investors see extreme fear as a buying opportunity, but it’s important to do your homework, manage risk (position sizing, stop-losses) and not assume the bottom is fully in.
Q5: What other signals should I watch alongside this index?
A5: Yes, look at on-chain metrics (wallet activity, token flows), funding rates in derivatives, support/resistance levels in charts, and macro/market-wide risk indicators (interest rates, equity markets).
Q6: How often is the index updated, and where can I view it?
A6: The index is updated daily and is available via websites that track crypto sentiment (e.g., alternative-assets sites). It’s best used alongside other market data rather than in isolation.